Delaware county basic supply and demand
•
0 likes•1 view

To help you select from the wide range of Delaware County Homes or if your needs take you to Bucks County, Montgomery County, Chester County or Philadelphia County, one of our Greater Philadelphia real estate agents will be glad to help you find your dream home.

Recommended
Recommended
More Related Content
What's hot
What's hot (15)
Similar to Delaware county basic supply and demand
Similar to Delaware county basic supply and demand (16)
More from Prudential Fox & Roach, Realtors
More from Prudential Fox & Roach, Realtors (20)
Recently uploaded
Recently uploaded (20)
Delaware county basic supply and demand
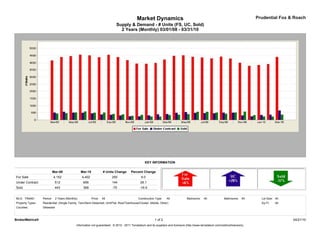
- 1. Market Dynamics Prudential Fox & Roach Supply & Demand - # Units (FS, UC, Sold) 2 Years (Monthly) 03/01/08 - 03/31/10 KEY INFORMATION Mar-08 Mar-10 # Units Change Percent Change For Sale 4,152 4,402 250 6.0 Under Contract 512 656 144 28.1 Sold 443 368 -75 -16.9 MLS: TReND Period: 2 Years (Monthly) Price: All Construction Type: All Bedrooms: All Bathrooms: All Lot Size: All Property Types: Residential: (Single Family, Twin/Semi-Detached, Unit/Flat, Row/Townhouse/Cluster, Mobile, Other) Sq Ft: All Counties: Delaware BrokerMetrics® 1 of 2 04/21/10 Information not guaranteed. © 2010 - 2011 Terradatum and its suppliers and licensors (http://www.terradatum.com/metrics/licensors).
- 2. Market Dynamics Prudential Fox & Roach Supply & Demand - # Units (FS, UC, Sold) 2 Years (Monthly) 03/01/08 - 03/31/10 FOR SALE UNDER CONTRACT SOLD EXPIRED NEW LISTINGS Time Period # Properties Average DOM # Properties Average DOM # Properties Average DOM # Properties Average DOM # Properties Mar-10 4,402 159 656 83 368 93 364 211 1,169 Feb-10 3,903 196 368 85 233 93 302 228 709 Jan-10 3,834 215 345 97 246 100 295 199 763 Dec-09 3,775 237 254 87 333 84 450 220 410 Nov-09 3,992 238 312 96 579 87 315 187 555 Oct-09 4,285 236 507 88 516 87 341 204 738 Sep-09 4,424 236 509 86 431 74 368 202 907 Aug-09 4,299 244 466 82 512 77 316 196 730 Jul-09 4,368 246 474 85 568 90 325 200 788 Jun-09 4,411 249 494 87 569 83 337 211 748 May-09 4,513 247 552 86 403 92 298 197 826 Apr-09 4,477 250 500 83 360 99 290 206 959 Mar-09 4,216 260 413 95 337 98 285 194 874 Feb-09 3,980 269 393 103 233 102 245 182 741 Jan-09 3,921 275 316 103 236 87 366 209 640 Dec-08 3,935 274 252 89 350 79 402 184 402 Nov-08 4,173 265 256 80 286 77 384 172 505 Oct-08 4,393 255 307 78 392 79 418 152 706 Sep-08 4,551 245 362 76 421 76 502 157 934 Aug-08 4,380 242 383 73 514 65 380 169 739 Jul-08 4,509 234 462 69 503 60 406 179 904 Jun-08 4,556 227 498 58 594 68 453 201 1,005 May-08 4,452 223 509 73 517 66 392 165 999 Apr-08 4,395 219 574 68 470 79 368 157 1,153 Mar-08 4,152 220 512 66 443 78 398 167 1,019 BrokerMetrics® 2 of 2 04/21/10 Information not guaranteed. © 2010 - 2011 Terradatum and its suppliers and licensors (http://www.terradatum.com/metrics/licensors).